Ammo Prices Graph & History Chart (2026) by Caliber
Compare average cost-per-round trends across popular calibers. Sourced from 196 retailers and 1,357,412 product listings. Data last updated July 30, 2026.
.22 LR Price Graph
.22 LR average price per round is $0.07 and is relatively flat for the last 90 days.
.380 ACP Price Graph
.380 ACP average price per round is $0.30 and is down 16.7% for the last 90 days. .380 ACP cost per round moved from $0.36 to $0.30.
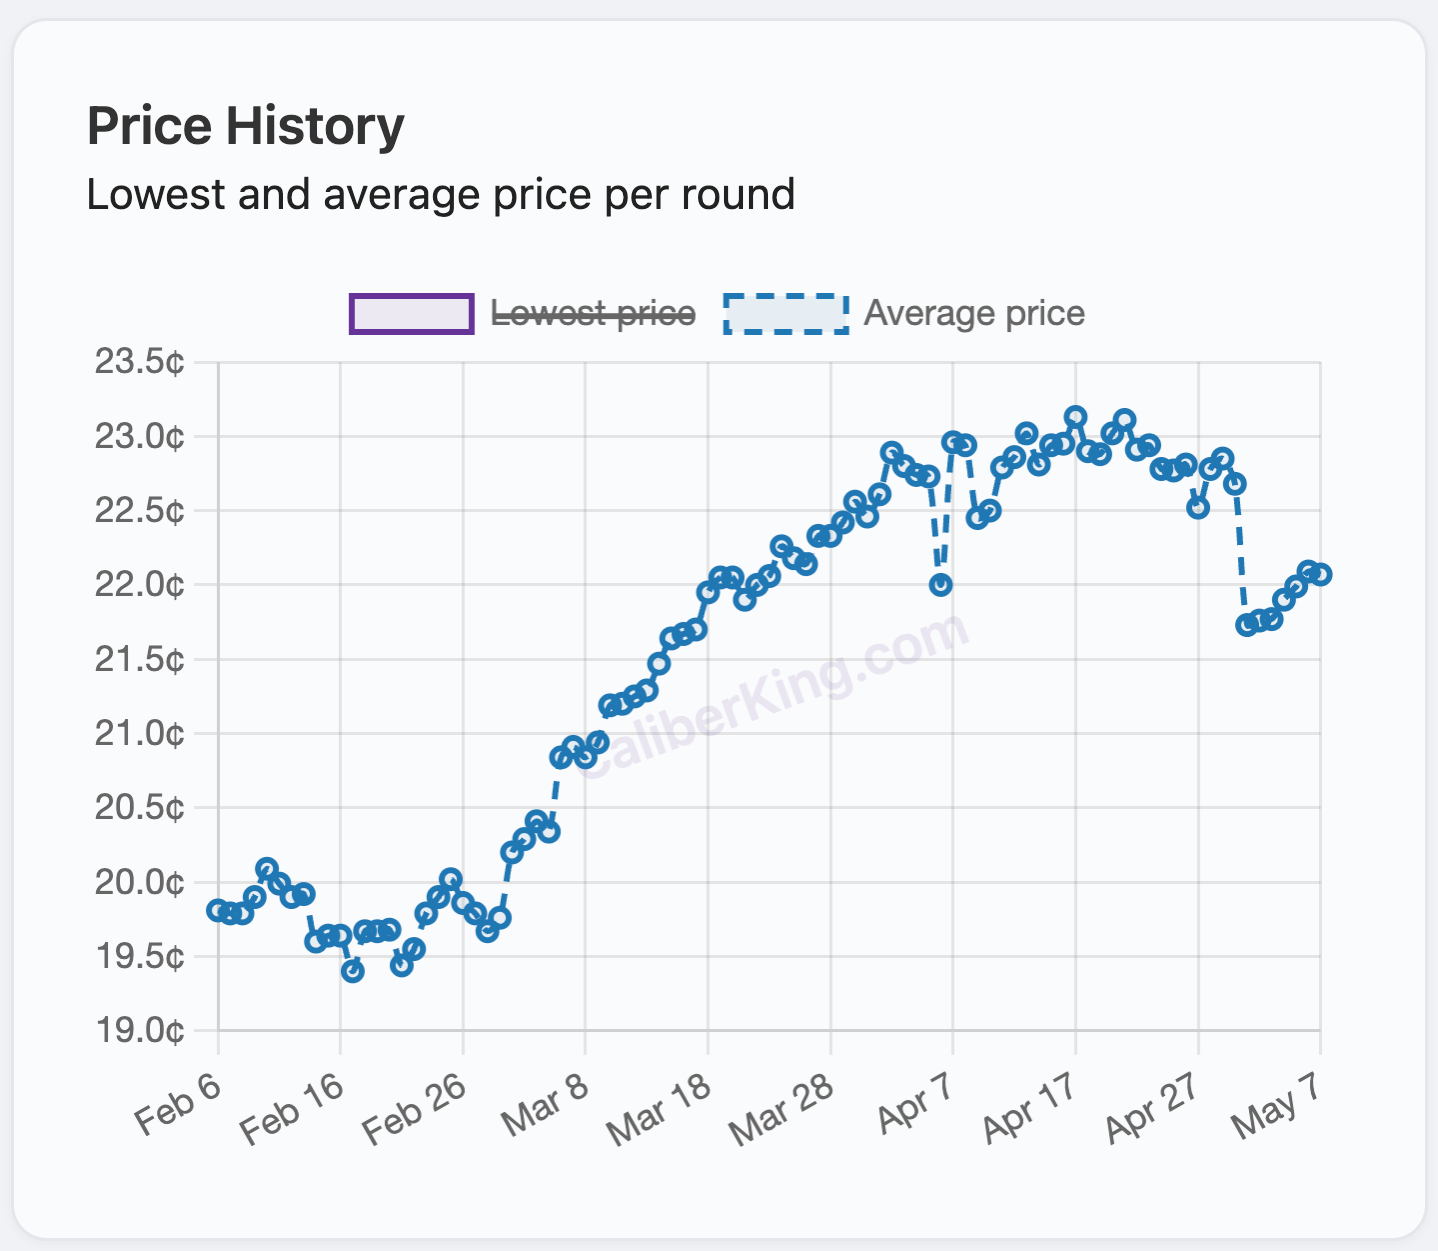
9mm Price Graph
9mm average price per round is $0.20 and is down 9.1% for the last 90 days. 9mm cost per round moved from $0.22 to $0.20.
.45 ACP Price Graph
.45 ACP average price per round is $0.37 and is down 7.5% for the last 90 days. .45 ACP cost per round moved from $0.40 to $0.37.
.357 Magnum Price Graph
.357 Magnum average price per round is $0.52 and is down 1.9% for the last 90 days. .357 Magnum cost per round moved from $0.53 to $0.52.
12 Gauge Price Graph
12 Gauge average price per round is $0.20 and is down 31.0% for the last 90 days. 12 Gauge cost per round moved from $0.29 to $0.20.
.300 Blackout Price Graph
.300 Blackout average price per round is $0.59 and is down 6.3% for the last 90 days. .300 Blackout cost per round moved from $0.63 to $0.59.
.223 Remington Price Graph
.223 Remington average price per round is $0.40 and is down 2.4% for the last 90 days. .223 Remington cost per round moved from $0.41 to $0.40.
5.56x45mm Price Graph
5.56x45mm average price per round is $0.44 and is down 4.3% for the last 90 days. 5.56x45mm cost per round moved from $0.46 to $0.44.
7.62x39mm Price Graph
7.62x39mm average price per round is $0.59 and is down 3.3% for the last 90 days. 7.62x39mm cost per round moved from $0.61 to $0.59.
6.5 Creedmoor Price Graph
6.5 Creedmoor average price per round is $1.09 and is up 0.9% for the last 90 days. 6.5 Creedmoor cost per round moved from $1.08 to $1.09.
.308 Win / 7.62x51mm Price Graph
.308 Win / 7.62x51mm average price per round is $0.87 and is relatively flat for the last 90 days.
Ammo Price Comparison Chart by Caliber
Side-by-side snapshot of 90-day price trends across popular calibers as of July 30, 2026. Compare trends from the charts above.
| Caliber | 90-Day Trend |
|---|---|
| .22 LR | Flat 0.0% (0¢/rd) |
| 9mm | Down 9.1% (-2¢/rd) |
| 12 Gauge | Down 31.0% (-9¢/rd) |
| .380 ACP | Down 16.7% (-6¢/rd) |
| .45 ACP | Down 7.5% (-3¢/rd) |
| .223 Remington | Down 2.4% (-1¢/rd) |
| 5.56x45mm | Down 4.3% (-2¢/rd) |
| .357 Magnum | Down 1.9% (-1¢/rd) |
| .300 Blackout | Down 6.3% (-4¢/rd) |
| 7.62x39mm | Down 3.3% (-2¢/rd) |
| .308 Win | Flat 0.0% (0¢/rd) |
| 6.5 Creedmoor | Up 0.9% (+1¢/rd) |
Monthly Ammo Price Report
At the start of each month, we'll email you our ammo price report so you can take advantage of market moves.
Unsubscribe anytime with one click.
How to Read These Charts
Each chart shows average price-per-round movement for a popular caliber over the last 90 days. Click any caliber title for a dedicated 180-day price chart, or use the search bar above for other calibers.
- Green trend text means prices are dropping; red means prices are rising.
- Compare multiple calibers side by side to spot relative value before you buy.
- Want the full methodology? Read our About Our Data page.
Frequently Asked Questions
What is an ammo price comparison chart?
An ammo price comparison chart lets you view average cost-per-round trends for multiple calibers side by side. Each chart on this page shows how ammunition prices have moved over the last 90 days so you can compare calibers before you buy.
How far back does your ammo price history go?
The charts on this page show the last 90 days of average price-per-round data. Click a caliber title for a dedicated price history page with the last 180 days when enough data is available.
Where can I see 9mm, .45 ACP, or 5.56 price history?
Scroll to the chart sections for 9mm, .45 ACP, and 5.56x45mm on this page, or open each caliber's dedicated ammo price chart page for a fuller 180-day history.
What is the average cost per round for popular calibers?
The summary under each chart shows the current average cost per round and whether prices are trending up, flat, or down over the last 90 days. Green means prices are dropping; red means prices are rising.
Where can I find pricing data for other calibers I'm looking for?
Type the caliber you're looking for in the search bar above and a pricing chart will be displayed for that caliber when sufficient historical data is available.
How often are these charts refreshed?
Our charts are updated at least daily but usually more often as new data is available.
How do I shop each caliber's ammo?
Open a caliber's price chart page and use the shop link, or search that caliber to browse live listings.
Can I use your pricing data in articles, blogs, or other content?
Yes. Link back to Caliber King and credit us as the source. See our About Our Data & Methodology page for full details and preferred attribution. Contact us at contact@caliberking.com for additional data or other formats.
Can your site generate charts for any product search?
Yes, we display price history charts for searches where sufficient historical pricing data is available.